

Dairy Management
Advance best management practices for dairy farming under irrigation
Objective
The objective of the project was to advance best management practices for dairy farming under irrigation that will ensure that the NZ Dairy Industry’s productivity gain is achieved in a sustainable manner and that the wider environment is protected.
Approach
This project was conducted on the new Lincoln University Dairy Farm that was established in 2001 and has the following characteristics and development profile.
Annual rainfall at the site is 650 mm, which is supplemented with approximately 500 mm of irrigation per annum. The initial stocking rate of the farm (2001) was 3.3 cows ha-1, which has increased every year to the current 4.2 cows ha-1 (2007). Stock type is Holstein Friesian, which produce 440 kg of milk solids (MS) per cow which is equivalent to 1740 kg MS ha-1 (2006/07 season). The cows are grazed outdoors at all times, with a main diet of grazed pasture, supplemented with small amounts of pasture silage when required.
The four main soils on the Lincoln University dairy farm are free-draining deep sandy soils (Paparua and Templeton soils), shallow stony soils (Eyre soils), imperfectly drained soils (Wakanui) and heavy, poorly-drained soils (Temuka clay loam).
The MAF(SFF)/Dairy InSight financial investment in this project has enabled us to install and use the following environmental monitoring facilities on the Lincoln University dairy farm to deliver the milestones listed in Table 1.
These facilities consist of:
- sixty soft-top lysimeters on the North Block of the farm to monitor nitrate concentrations in the drainage water from the free-draining soils;
- a pipe-drainage system on the South Block of the farm to measure nitrate concentrations in the drainage water from heavy poorly-drained clay soils;
- a suite of eight groundwater monitoring wells to measure the risk of microbial contamination due to grazing animals and farm dairy effluent application to the soil.
Lysimeter programme to measure leaching losses
Sixty ‘soft-top’ lysimeters were installed in 6 locations in the free-draining soils on the North Block of the Lincoln University Dairy Farm (Plates 4.1 & 4.2).

Plate 4.1. Environmental monitoring system for dairying on lighter free-draining soils

Plate 4.2. Collection of soil lysimeters on Lincoln University Dairy Farm
Drainage water was collected from each lysimeter immediately after rainfall, or irrigation, had generated a drainage loss. The drainage water was analysed for nitrate (NO3-) and ammonium (NH4+) concentrations using flow injection analysis (FIA).
Pipe drainage measurement and monitoring system
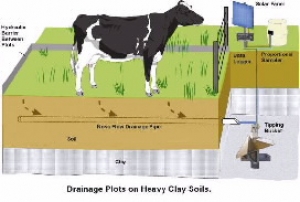
Because the Temuka soils have impervious subsoil they are best suited to a pipe drainage measurement and monitoring system (Plate 4.3), and unsuited to lysimeter monitoring. ‘Nova-flow’ drainage pipes have been installed in hydraulically isolated drainage plots (each 100m2) in the Temuka soil on the South Block of the new dairy farm (Plate 4.4).

Plate 4.3. Environmental monitoring system for dairying on heavier, slow-draining soils

Plate 4.4. Aerial view of the drainage plots under construction
Automatic samplers (Plates 4.5) are used to collect drainage water samples from the pipe drain outfalls. Automatic drainage water samplers are connected to each outfall in order to collect the drainage water in proportion to the flow rate in the drains. Tipping-bucket sensors determine flow rate automatically. Rainfall and irrigation are recorded at the site using a tipping bucket rain gauge, attached to a data logger. Data from the drainage samplers, rain gauge and other sensors are sent by solar powered, telemetry (Plate 4.6) to the Centre’s laboratories.

Plate 4.5. Specially-constructed tipping bucket units to measure the drainage flow rate

Plate 4.6. The drainage plots immediately outside the electric fence are grazed by cows the same as the rest of the farm paddocks
Groundwater monitoring
The free-draining soils on the North Block of the farm overlay an unconfined aquifer at between 4 to 8m depth below ground level. Eight groundwater-monitoring wells were installed on the North Block of the farm (Plates 4.7 and 4.8) in order to collect samples from the unconfined aquifer. Samples of groundwater water were collected on a monthly basis from 9-12m depth below ground surface and analysed for faecal coliforms and Campylobacter by ESR staff.

Plate 4.7. Site plan of wells installed on the Lincoln University Dairy Farm

Plate 4.8. Groundwater monitoring wells being drilled on the North Block of the Dairy Farm
Water samples were collected monthly and analysed for N (NO3-, NH4+) and in collaboration with ESR staff, selected microbes (E coli. and campylobacter).
Outcomes
Summary of results
Lysimeters
On-farm monitoring of nitrate leaching on the LUDF using 60 lysimeters within the grazed paddocks indicates that to the present date the average nitrogen leaching losses for this farm are relatively low. The average nitrate leaching loss since conversion of the Lincoln University Dairy Farm is around 20 kg N ha-1 yr-1 (Figure 5.1). Over the first four years the loss was less than 20 kg N ha-1 yr-1 and over the last winter (2006) the leaching loss was higher at around 55 kg N ha-1 yr-1. The N leached was predominantly as NO3- (> 99%) with only trace amounts of NH4+ or NO2-.
The variation in annual leaching losses emphasises the need to use a multi-year average value rather than using a single year value when trying to quantify N leaching losses from dairy farms.

Figure 5.1: Amount of nitrate-N leached from Lincoln University Dairy Farm lysimeters (2002 – 2007)
The larger amount of nitrate leached over 2006/07 season is attributed to the larger than average amount of drainage (230 vs 135 mm; Figure 5.2) which was caused by the high winter rainfall in 2006. In contrast, the very dry winter of 2005/06 (34 mm of drainage) produced a relatively low leaching loss (12 kg N ha-1 yr-1) (Figure 5.1).

Figure 5.2: Average annual drainage (mm) from the lysimeters on the LUDF
The relatively low average nitrate leaching loss from this recently converted dairy farm is also due, at least in part, to the immobilisation of nitrogen into the organic matter that is building up in the soil. (Prior to conversion into a dairy farm this land was mainly used for dryland sheep pasture.) Chemical analysis shows that the average soil carbon level on LUDF has increased from 2.88% in 2002 to 3.52% in 2007; this represents a 23% increase in 5 years (Table 1). Total nitrogen levels in the soil have also increased from 0.27% to 0.32% in 2007; this represents an 18% increase in 5 years.
Table 1: Changes in soil carbon and total nitrogen on Lincoln University Dairy Farm (2002 – 2007). Mean ± standard error
| Aug-02 | Aug-07 | % Increase since 2002 | |||||
|---|---|---|---|---|---|---|---|
| Total C % |
Total N % |
C:N Ratio | Total C % |
Total N % |
C:N Ratio | C % |
N % |
| 2.88 | 0.27 | 10.7 | 3.52 | 0.32 | 11.2 | 22.6 | 17.9 |
| ± 0.12 | ± 0.02 | ± 0.17 | ± 0.19 | ± 0.03 | ± 0.30 | ||
Use of the nitrification inhibitor technology eco-n has been shown to significantly reduce N leaching losses from grazed pasture soils, improving the efficiency of N use in the farming system (Christie, 2004; Di & Cameron, 2005). Research work has shown that eco-n nitrification inhibitor technology is very effective in reducing NO3- leaching (Figure 5.3) (Di & Cameron, 2002, 2004, 2005) and N2O emissions (Figure 5.4; Di & Cameron, 2002, 2003, 2006; Di et al., 2007).
Research work in this project on LUDF has confirmed that application of eco-n nitrification inhibitor can reduce NO3- N leaching by between 40 to 80% from urine patch areas (Figure 5.3).

Figure 5.3: Effect of eco-n on reducing nitrate leaching loss from urine affected lysimeters
Eco-n nitrification inhibitor can also reduce N2O emission by 73% on Templeton soil lysimeters collected from the LUDF (Figure 5.4)

Figure 5.4: Daily N2O emissions from the Canterbury Templeton soil (Di et al., 2007)
Pasture trials on LUDF have also demonstrated significant pasture growth responses to the application of ‘eco-n’ nitrification inhibitor (Figure 5.5; Moir et al., 2007). On a whole paddock basis, the mean increase in annual pasture yield on the LUDF eco-n trial was 21% (Figure 5.5).

Figure 5.5: Mean annual pasture yield 2002/03 – 2005/06 in inter-urine patch and urine patch areas of the sward (Moir et al., 2007)
Drainage plots
Results from the drainage plots on the heavy Temuka clay soil show a range of nitrate-N leaching losses over the past four years from 3 to 84 kg N ha-1 yr-1 with an average annual of 22 kg N ha-1 yr-1 (Figure 5.6). The greatest leaching loss in 2006/07 was associated with a large amount of drainage due to the high winter rainfall that occurred in 2006/07 (Figure 5.7) plus cultivation of the soil to re-sow new pasture in this paddock.

Figure 5.6: Average amount of nitrate-N leached from Lincoln University Dairy Farm Drainage Plots (Temuka clay soil) (2003-07)

Figure 5.7: Average amount of drainage from the Lincoln University Dairy Farm drainage plots (Temuka clay soil) (2002-07)
Groundwater monitoring wells
The wells were separated into up-gradient and down-gradient wells based on their location on the farm relative to the flow direction of the groundwater in the aquifer. Between 2001 and 2007, over 650 groundwater samples were analysed for faecal coliforms and Campylobacter. The results show that 5.4% of samples from up-gradient wells with detections of faecal coliforms at concentrations of 1 cfu/100 ml or greater (Table 2), whilst only 2.8% of samples from down-gradient wells with detections of faecal coliforms at concentrations of 1 cfu/100 ml or greater (Table 3). There have been 0.7% of samples with detections of Campylobacter over the six-year period, with equal percentages from up- and down-gradient wells (Tables 2 and 3).
Table 2: Summary of microbial monitoring results for Lincoln Farm Groundwater for up-gradient wells
| Time period for sampling | FC (positive total) |
FC (%) |
FC concentrations (cfu/100 ml) |
Campy (positive/ total) |
Campy (%) |
|---|---|---|---|---|---|
| Sept 01 – June 02 | 4/47 | 8.5 | 1 - 32 | 0/57 | 0 |
| July 02 – June 03 | 1/42 | 2.4 | 1 | 0/42 | 0 |
| July 03 – June 04 | 1/33 | 3.0 | 1 | 1/40 | 2.5 |
| July 04 – June 05 | 4/45 | 8.9 | 1 - 2 | 0/45 | 0 |
| July 05 – June 06 | 1/47 | 2.1 | 3 | 1/47 | 2.1 |
| July 06 – June 07 | 3/43 | 7.0 | 1 – 3 | 0/43 | 0 |
| Total | 14/257 | 5.4 | 2/274 | 0.7 |
Note: FC = faecal coliforms; Campy = Campylobacter.
Positive/total = number of positive samples/total number of samples
Table 3: Summary of microbial monitoring results for Lincoln Farm Groundwater for down-gradient wells
| Time period for sampling | FC (positive/ total) |
FC (%) |
FC concentrations (cfu/100 ml) |
Campy (positive/ total) |
Campy (%) |
|---|---|---|---|---|---|
| Sept 01 – June 02 | 5/76 | 6.6 | 1 - 6 | 0/89 | 0 |
| July 02 – June 03 | 0/70 | 0 | 1/70 | 1.4 | |
| July 03 – June 04 | 0/60 | 0 | 0/72 | 0 | |
| July 04 – June 05 | 1/60 | 1.7 | 2 | 0/60 | 0 |
| July 05 – June 06 | 2/60 | 3.3 | 2 | 2/60 | 3.3 |
| July 06 – June 07 | 3/68 | 4.4 | 1 - 2 | 0/68 | 0 |
| Total | 11/394 | 2.8 | 3/419 | 0.7 |
Note: FC = faecal coliforms; Campy = Campylobacter.
Positive/total = number of positive samples/total number of samples.
Results from this study show that application of dairy farm effluent at an equivalent rate to 200 kg N per hectare per year onto free-draining Templeton and Eyre soils under spray irrigation on the farm has had little, if any, impact on microbial quality of groundwater. This indicates that the soil is either filtering out the microbes that are deposited onto the land, or that the soil delays their transport for a sufficiently long period to cause the bacteria to die off. The Templeton soil on the Lincoln University dairy farm has a uniform soil structure and water flow mostly occurs through the soil matrix (which may filter out microbes) rather than through soil macropores.
Preliminary data from a study to determine the die-off rates of microbes in the unsaturated zone of the aquifer indicate that Campylobacter dies off rapidly in the unsaturated zone – about 4 orders of magnitude reduction in 2 weeks. E. coli survives much longer – about a half order of magnitude (factor of 2 or 3) reduction in 3 months.
Hydrological measurements indicate that the transit time for solutes dissolved in the shallow unconfined aquifer below LUDF are between 1 to 12 months depending on the specific hydraulic gradient at the time.
Groundwater flow beneath the Lincoln University Dairy Farm is the result of several components that include river recharge, climate-driven land surface recharge at regional and local scale, and pumped abstraction at regional and local scale. These components are combined in proportions that vary from year to year, and within seasons. This results in an ever-changing pattern of hydraulic pressure in the aquifer, which is observed as groundwater level. Groundwater flow, at a particular location, is determined by the gradient of the groundwater pressure (level) at that location. Thus, the magnitude and direction of groundwater flow are changing continuously. This variability combined with nitrate inputs from land use up-gradient of the LUDF makes it very difficult to interpret the groundwater nitrate results. The conclusion is that simply measuring temporal changes in nitrate concentration in groundwater below an individual farm is not a sufficiently robust method to determine the effect of that farm on groundwater nitrate concentrations. Lysimeter methods provide a more reliable method of measurement.
Extension of results
Between April 2004 to June 2007, 126 presentations were made on the project to stakeholder groups (Table 4).
Table 4: List of presentations on project made to stakeholder groups
| Date of Visit | Stakeholder Group |
|---|---|
| 1 April 2004 | Farmwise consultants |
| 19 April 2004 | DipAg 1960-61 Lincoln Alumni Visitors |
| 12 May 2004 | Australian Chief Veterinary Officers |
| 25 May 2004 | Coopworth Sheep Society Conference Delegates |
| 27 May 2004 | Dairy InSight Board and Senior Executives |
| 21 May 2004 | SEARCA Livestock Philippines visitors |
| 22 May 2004 | Chinese Agricultural Co-operatives Visitors |
| 5 Aug 2004 | FAR Arable Farmers Conference |
| 11 Aug 2004 | US Congress staffers with MFAT |
| 18 Aug 2004 | NZ Institute of Agricultural Science |
| 26 Aug 2004 | Ravensdown Field Officers (Upper SI) |
| 23 Sept 2004 | Dexcel Board |
| 7 Oct 2004 | INIA research agency, Uruguay |
| 8 Oct 2004 | Irrigation Association Conference field trip |
| 14 Oct 2004 | Forest and Bird delegation |
| 18 Oct 2004 | Dexcel scientist group (Errol Thom) |
| 21 Oct 2004 | Mike Goss, Guelph University, Canada |
| 23 Nov 2004 | French science delegation |
| 29 Nov 2004 | Director UFZ Centre for Environmental research, Liepzig-Halle Research Station, Germany. |
| 3 Dec 2004 | Ravensdown Field Officers |
| 3 Dec 2004 | President US-NZ Council (John Mullen) MFAT Director Americas Division (Roy Ferguson) |
| 3 Feb 2005 | Presented results from the drainage plot study to c. 250 farmers attending the Lincoln University Dairy Farm Focus Day |
| 4 Feb 2005 | Presented results from the drainage plot study, and other research, to Hon. Pete Hodgson during a visit to Lincoln University |
| 7 & 8 Feb 2005 | Presented results from the drainage plot study, and other research, to Ravensdown Field Officers and farmer groups |
| 1 March 2005 | Gave overview of environmental research project to senior staff from Livestock Improvement. |
| 7 April 2005 | Gerald Rys, MAF |
| 11 April 2005 | Dexcel Farmer seminar |
| 19 April 2005 | Inter. Large Herds Conference Field Trip to Lincoln University Dairy Farm (c. 500 people) |
| 4 May 2005 | Waikato Times journalist (Geoff Taylor) |
| 6 May 2005 | Phil Journeaux, MAF, and Hilton Furness, FertResearch, |
| 12 May 2005 | Dexcel Farmer seminar |
| 18 May 2005 | Journalist from the Christchurch Press (Tim Cronshaw) |
| 20 May 2005 | Australian Dept. of Primary Industry scientists |
| 13 June 2005 | OECD Environmental Performance Review team plus MFAT, MAF and ECan staff |
| 16 June 2005 | FarmRight farm consultants and farmers |
| 20 June 2005 | South Island Dairy Event (SIDE) presentation on improved N use in dairying |
| 30 June 2005 | Manawatu ‘Dairy Team’ farmers and consultants |
| 30 June 2005 | Japan Broadcasting Company (NHK) TV crew |
| 5 July 2005 | Dexcel farmer group from lower North Island |
| 15 July 2005 | Enviro Waikato Grp Mgr of Resource Use & Environ. (Chris McLay) |
| 22 July 2005 | MFAT led US Climate Change Expert Group |
| 3 Aug 2005 | Ravensdown Field Officers from Southland |
| 4 Aug 2005 | Crafar Dairy Holdings from central North Island (with Ravensdown) |
| 17 Aug 2005 | John Carradus Dairy 21 |
| 19 Aug 2005 | Dairy Park Group from Teagasc, Ireland |
| 26 Aug 2005 | Dairy InSight investment team and MAF SFF manager |
| 29 Aug 2005 | Uruguay dairy farmers |
| 1 Sept 2005 | Central Plains Water board members and representatives |
| 1 Sept 2005 | Telford Polytechnic Council representatives |
| 5 Sept 2005 | Christchurch School of Medicine post-graduate student group |
| 14 Sept 2005 | Missouri University staff |
| 7 Oct 2005 | Diane Rodgers, Central Plains Water sustainability consultant |
| 21 Oct 2005 | Dairying and Environment Conference |
| 1 Nov 2005 | Seed and Grain merchants course participants |
| 3 Nov 2005 | South Otago dairy farmer group |
| 3 Nov 2005 | Beijing Agricultural University delegation |
| 4 Nov 2005 | NZ Irrigation Conference at Darfield (invited paper) |
| 8 Nov 2005 | LIC Board of Directors and Senior Managers |
| 1 Feb 2006 | Ravensdown Field Officers |
| 8 Feb 2006 | Taranaki dairy farmers with Dexcel |
| 21 Feb 2006 | Dairy Farmers of New Zealand annual conference |
| 14 March 2006 | Journalist (Philippa Toley) from National Radio |
| 4 Apr 2006 | Science Model Developers Group with AgResearch staff |
| 5 Apr 2006 | Dairy farmer group |
| 7 Apr 2006 | National Party Agriculture Caucus Committee |
| 7 Apr 2006 | Spray Contractors and Ravensdown Field Officers |
| 13 Apr 2006 | Farmer group |
| 21 Apr 2006 | International Plant Breeders Conference Delegates |
| 28 Apr 2006 | Scientists from Rothamsted, UK |
| 11 May 2006 | Dairy Farmers from N. Island with Ravensdown |
| 12 May 2006 | Minister of Agriculture & MAF + MfE Officials |
| 15 May 2006 | Dairy Farmers from N. Island with Ravensdown |
| 15 May 2006 | Mark Leslie, Fonterra |
| 1 June 2006 | Australian Dairy Farmer Group with NZ Federated Farmers |
| 1 June 2006 | Farmer winter feed group with Ravensdown |
| 18 July 2006 | Dairy Farmer Group from North Island (Crafar Group) |
| 19 July 2006 | Sandy Callister and Jude Hooson of ‘The Providence Report’ |
| 19 July 2006 | David Wright, CEO, Dairy InSight |
| 20 July 2006 | Agriculture ITO student group |
| 25 July 2006 | Blair Robinson, Fonterra |
| 26 July 2006 | North Island dairy farmers with Ravensdown |
| 27 July 2006 | Ravensdown Field Officers |
| 3 Aug 2006 | Lincoln University student group |
| 4 Aug 2006 | Invited presentation to Canterbury Strategic Water Group ( at Rolleston) |
| 8 Aug 2006 | PGGRC review team |
| 8 Aug 2006 | Crop & Food scientists |
| 16 Aug 2006 | Presentation to Media group visiting Lincoln |
| 21 Aug 2006 | Medical students from Christchurch School of Medicine |
| 28 Aug 2006 | Video crew for ‘Hot Science’ video production for schools |
| 7 Sept 2006 | FRST Business Manager (Barbara Brown) |
| 20 Sept 2006 | US Ambassador (William McCormick) plus US Embassy staff and media |
| 21 Sept 2006 | British High Commissioner (George Fergusson) |
| 9 Oct 2006 | Journalist from Dairying Today (Coos Baars) visit |
| 18 Oct 2006 | Meeting with ECan CEO and staff regarding nitrate leaching |
| 24 Oct 2006 | Wuhan University, China, delegation visit |
| 25 Oct 2006 | Prof Di invited lecture to Royal Society meeting Canterbury Univ. |
| 31 Oct 2006 | Invited lecture at Lincoln Resource/ SIDDC evening public workshop |
| 6 Nov 2006 | Beijing Academy of Agricultural Sciences delegation visit |
| 10 Nov 2006 | Ravensdown staff visit |
| 21 Nov 2006 | Australian Federal Member of Parliament delegation visit |
| 21 Nov 2006 | EU farmer group visit |
| 22 Nov 2006 | Dairy Holdings and Water Rights Trust visit |
| 23 Nov 2006 | Director General of Agriculture of Western Australia and Director General Primary Industry of NSW visit |
| 24 Nov 2006 | Wuhan University Agriculture delegation visit |
| 28 Nov 2006 | Irish farmer group visit |
| 29 Nov 2006 | Hon Jim Anderton, Minister of Agriculture with MAF(SFF) staff visit |
| 8 Dec 2006 | Warwick McDonald, Dairy Industry Environmental Manager, Dexcel |
| 13 Feb 2007 | Warwick McDonald, Dairy Industry Environmental Manager, Dexcel plus Cathy Phelps, Dairy Australia visit. |
| 15 Feb 2007 | Presentation at Dexcel & Ravensdown field day on Waitaki Plains |
| 19 Feb 2007 | Visitors from Michigan State University |
| 6 Mar 2007 | Invited workshop on nitrate leaching for Environment Canterbury staff |
| 7 Mar 2007 | Dairy farmer group (45) with Ravensdown field officers |
| 4 April 2007 | Parliamentary Commissioner for the Environment (Dr Jan Wright) & Warwick McDonald |
| 4 April 2007 | Waikato Dairy Farmers with Ravensdown |
| 11 April 2007 | University of the 3rd Age visitors |
| 13 April 2007 | Ag/Hort Secondary Teachers Refresher Course |
| 19 April 2007 | North Island Farmers with Walling Contractors and Ravensdown |
| 3 May 2007 | Eco-n pasture results presented at LUDF Focus Day |
| 3 May 2007 | Dairy InSight staff (Phil Urlich) with Ravensdown visited Lysimeter facility |
| 14 May 2007 | Rubus Group visit with Ravensdown |
| 17 May 2007 | MAF Senior Policy Advisors (Julie Collins and Bob Zuur) |
| 23 May 2007 | Ravensdown Customer Centre Staff training |
| 8 June 2007 | President of Federated Farmers (Charlie Pederson) |
| 11 June 2007 | Chinese Dairy Farming Cooperative members |
| 19 June 2007 | Paper on project presented at SIDE conference (Moir et al. 2007) |
| 25 June 2007 | Australian Dairy Farmers (40) visit with Federated Farmers |
Further plans for the project
Key components of this environmental monitoring project will continue under funding from Dairy InSight/ Dexcel (with a particular focus on nitrates).
References
Christie, R (2004). Using the nitrification inhibitor (eco-n) on New Zealand dairy farms. Primary Industry Management. 7: 38-41, March 2004.
Di, H J and Cameron, K C (2004). Treating grazed pasture soil with a nitrification inhibitor, eco-nTM, to decrease nitrate leaching in a deep sandy soil under spray irrigation. New Zealand Journal of Agricultural Research 47(3): 351-361.
Di, H J and Cameron, K C (2002). The use of a nitrification inhibitor, dicyandiamide (DCD), to decrease nitrate leaching and nitrous oxide emissions in a simulated grazed and irrigated grassland. Soil Use and Management, 18: 395-403.
Di, H J and Cameron, K C (2003). Mitigation of nitrous oxide emissions in spray-irrigated grazed grassland by treating the soil with dicyandiamide, a nitrification inhibitor, Soil Use and Management 19: 284-290.
Di, H J and Cameron, K C (2004). Effects of temperature and application rate of a nitrification inhibitor, dicyandiamide (DCD) on nitrification rate and microbial biomass in a grazed pasture soil. Australian Journal of Soil Research 42: 927-932.
Di, H J and Cameron, K C (2004). Effects of the nitrification inhibitor, dicyandiamide on potassium, magnesium and calcium leaching in grazed grassland. Soil Use and Management 20: 2-7.
Di, H J and Cameron, K C (2005). Reducing environmental impacts of agriculture by using a fine particle suspension nitrification inhibitor to decrease nitrate leaching from grazed pastures. Agriculture, Ecosystems and Environment 109: 202-212.
Di, H J and Cameron, K C (2006). Nitrous oxide emissions from two dairy pasture soils as affected by different rates of a fine particle suspension nitrification inhibitor, dicyandiamide (DCD). Biology and Fertility of Soils 42: 472-480.
Moir, J L, Cameron, K C and Di, H J (2007). Effects of the nitrification inhibitor dicyandiamide on soil mineral N, pasture yield, nutrient uptake and pasture quality in a grazed pasture system. Soil Use and Management 23: 111-120.
Di, H J, Cameron, K C and Sherlock, R R (2007). Comparison of the effectiveness of a nitrification inhibitor, dicyandiamide, in reducing nitrous oxide emissions in four different soils under different climatic and management conditions. Soil Use and Management 23: 1-9.